Market Outlook
May 03, 2017
Market Cues
Domestic Indices
Chg (%)
(Pts)
(Close)
Indian markets are likely to open in green and maintain positive traction tracking the
BSE Sensex
0.0
83
29,921
SGX Nifty & global cues.
Nifty
0.1
10
9,314
Following the lackluster performance seen over the past few sessions, US markets
Mid Cap
0.4
57
14,855
continued to show a lack of direction during trading on Tuesday. The major
Small Cap
0.3
148
15,421
averages spent the day bouncing back and forth across the unchanged line. The
choppy trading on Wall Street came as traders looked ahead to the Federal
Bankex
0.1
16
25,341
Reserve's monetary policy announcement on Wednesday.
The European markets ended Tuesday's session with modest gains. Investor
Global Indices
Chg (%)
(Pts)
(Close)
sentiment received a boost from the news that Greece has agreed to a bailout deal.
Dow Jones
0.2
136
20,950
Upbeat economic data also contributed to the positive mood among investors.
Nasdaq
0.1
54
6,095
British manufacturing activity expanded at the sharpest pace in three years and
FTSE
0.6
46
7,250
Eurozone manufacturing activity also expanded at the fastest pace in six years.
Nikkei
(00.7
135
19,446
Indian markets fluctuated before closing on a flat note on Tuesday even as upbeat
Hang Seng
0.3
281
24,696
auto sales figures and manufacturing PMI data painted a positive picture of the
Shanghai Com
(0.3)
(11)
3,144
economy. With a two-day meeting of the U.S. Federal Reserve getting underway
later today, investors seem to have exercised some caution at higher levels.
Advances / Declines
BSE
NSE
News Analysis
Advances
1,365
1,769
Asian Granito eyes `2,000Cr revenue by 2020, bets on marble, quartz biz
Declines
1,550
932
Detailed analysis on Pg2
Unchanged
152
91
Investor’s Ready Reckoner
Key Domestic & Global Indicators
Volumes (` Cr)
Stock Watch: Latest investment recommendations on 150+ stocks
BSE
4,063
Refer Pg6 onwards
NSE
25,975
Top Picks
#Net Inflows (` Cr)
Net
Mtd
Ytd
CMP
Target
Upside
Company
Sector
Rating
(`)
(`)
(%)
FII
(1,114)
(2,209)
42,012
Blue Star
Capital Goods
Accumulate
675
760
12.7
MFs
8258
9,918
19,355
Dewan Housing Fin. Financials
Accumulate
447
460
2.9
Mahindra Lifespace Real Estate
Buy
444
522
17.5
Navkar Corporation Others
Buy
214
265
23.8
Top Gainers
Price (`)
Chg (%)
KEI Industries
Capital Goods
Accumulate
214
239
11.3
Godrejprop
505
8.9
More Top Picks on Pg4
Dcbbank
197
7.4
Supremeind
1,160
6.7
Key Upcoming Events
Previous
Consensus
Sobha
396
6.5
Date
Region
Event Description
Reading
Expectations
Ibulhsgfin
1,077
5.9
May 03, 2017 US
FOMC rate decision
1.00
1.00
May 03, 2017 Germany Unemployment change (000's)
(30.00)
(11.00)
May 03, 2017 Euro Zone Euro-Zone GDP s.a. (QoQ)
0.50
0.50
Top Losers
Price (`)
Chg (%)
May 04, 2017 US
Change in Nonfarm payrolls
98.00
190.00
Jswenergy
262
(7.1)
May 04, 2017 US
Initial Jobless claims
257.00
248.00
Adanitrans
75
(3.6)
May 05, 2017 Germany PMI Services
54.70
54.70
Glaxo
2,423
(3.1)
More Events on Pg5
Intellect
125
(3.1)
J&Kbank
79
(3.1)
#As on May 02, 2017
Market Outlook
May 03, 2017
News Analysis
Asian Granito eyes `2,000Cr revenue by 2020, bets on marble,
quartz biz
Aiming to be the third largest ceramic products maker in India, Asian Granito
India Limited (AGL) is betting on the marble and quartz segments to achieve a
turnover of `2,000Cr by the end of the year 2020.
The company has posted turnover of about `1,085Cr in the year 2016-17
and currently ranks fourth in the ceramics space in India. The marble and
quartz stone segments are two of the key focus areas for the company, going
forward. AGL recently completed expansion of the third line for quartz stone at
its Himmatnagar plant and started commercial production this month.
With this, the company doubled its quartz stone capacity to 1,600 square
meters a day. According to AGL, the market for quartz stone in India is
estimated at `200-250Cr and is growing at 25-30 per cent a year.
Economic and Political News
Fitch affirms India's sovereign rating at 'BBB-'
Govt cuts oil import plans from Iran by a quarter over gas field row
Govt to award contracts for 55,000 km of highways in 2 yrs: Nitin Gadkari
It might be difficult to implement compulsory prescription of generics
Corporate News
Marico Q4 net profit up 25.5% at `170.91Cr
RInfra revises InvIT issue size downwards to `2,500Cr
SC rejects Essar Steel's plea seeking exemption from power dues in Gujarat
Coal India April 2017 production slips 4.1%
Inox PAT down 62% in FY17
Market Outlook
May 03, 2017
Quarterly Bloomberg Brokers Consensus Estimate
ICICI Bank Ltd - May 3, 2017
Particulars ( ` cr)
4QFY17E
4QFY16
y-o-y (%)
3QFY17
q-o-q (%)
Net profit
2,293
3,056
(25.0)
2,442
6.1
Exide Industries Ltd - May 4, 2017
Particulars ( ` cr)
4QFY17E
4QFY16
y-o-y (%)
3QFY17
q-o-q (%)
Net sales
1,969
1,756
12.1
1,725
14.1
EBITDA
287
267
7.2
230
24.9
EBITDA margin (%)
14.6
15.2
13.3
Net profit
178
178
0.4
151
17.6
Housing Development Finance Corp - May 4, 2017
Particulars ( ` cr)
4QFY17E
4QFY16
y-o-y (%)
3QFY17
q-o-q (%)
Net profit
2,020
2,607
(22.5)
1,701
18.7
Bharti Infratel Consol - May 8, 2017
Particulars ( ` cr)
4QFY17E
4QFY16
y-o-y (%)
3QFY17
q-o-q (%)
Net sales
3,486
3,162
10.3
1,530
127.8
EBITDA
1,540
1,425
8.1
706
118.3
EBITDA margin (%)
44.2
45.1
46.1
Net profit
700
662
5.8
620
12.9
ABB India Ltd - May 8, 2017
Particulars ( ` cr)
1QCY17E
1QCY16
y-o-y (%)
4QCY16
q-o-q (%)
Net sales
2,224
1,976
12.5
2,441
(8.9)
EBITDA
195
149
30.5
282
(31.0)
EBITDA margin (%)
8.7
7.5
11.5
Net profit
92
71
29.8
147
(37.3)
Market Outlook
May 03, 2017
Top Picks ★★★★★
Market Cap
CMP
Target
Upside
Company
Rationale
(` Cr)
(`)
(`)
(%)
Strong growth in domestic business due to its leadership
in acute therapeutic segment. Alkem expects to launch
Alkem Laboratories
23,765
1,988
2,257
13.6
more products in USA, which bodes for its international
business.
We expect the company would report strong profitability
Asian Granito
1,154
384
405
5.6
owing to better product mix, higher B2C sales and
amalgamation synergy..
Among the top
4 players in the consumer durables
Bajaj Electricals
3,570
353
395
12.1
segment. Improved profitability backed by turn around in
E&P segment. Strong order book lends earnings visibility.
Favourable outlook for the AC industry to augur well for
Cooling products business which is out pacing the market
Blue Star
6,447
675
760
12.7
growth. EMPPAC division's profitability to improve once
operating environment turns around..
With a focus on the low and medium income (LMI)
consumer segment, the company has increased its
Dewan Housing Finance
14,010
447
460
2.9
presence in tier-II & III cities where the growth opportunity
is immense.
Strong loan growth backed by diversified loan portfolio
and adequate CAR. ROE & ROA likely to remain decent
Equitas Holdings
5,498
163
235
44.4
as risk of dilution remains low. Attractive valuations
considering growth.
Economic recovery to have favourable impact on
advertising & circulation revenue growth. Further, the
Jagran Prakashan
6,458
198
225
13.9
acquisition of a radio business (Radio City) would also
boost the company's revenue growth.
High order book execution in EPC segment, rising B2C
KEI Industries
1,668
214
239
11.3
sales and higher exports to boost the revenues and
profitability
Speedier execution and speedier sales, strong revenue
Mahindra Lifespace
1,824
444
522
17.5
visibilty in short-to-long run, attractive valuations
Massive capacity expansion along with rail advantage at
Navkar Corporation
3,052
214
265
23.8
ICD as well CFS augurs well for the company
Strong brands and distribution network would boost
Siyaram Silk Mills
1,569
1,674
1,872
11.9
growth going ahead. Stock currently trades at an
inexpensive valuation.
Market leadership in Hindi news genre and no.
2
viewership ranking in English news genre, exit from the
TV Today Network
1,615
271
344
27.1
radio business, and anticipated growth in ad spends by
corporates to benefit the stock.
Source: Company, Angel Research
Market Outlook
May 03, 2017
Key Upcoming Events
Result Calendar
Date
Company
May 3, 2017
ICICI Bank, Alembic Pharma
May 4, 2017
Exide Industries, Bank of Maharashtra, MRF
May 5, 2017
Apollo Tyres, Visaka Industries, Aventis
May 6, 2017
L G Balakrishnan & Bros
Source: Bloomberg, Angel Research
Global economic events release calendar
Date
Time
Country
Event Description
Unit
Period
Bloomberg Data
Last Reported Estimated
May 3,, 2017 11:30PM US
FOMC rate decision
%
May 3
1.00
1.00
1:25PM Germany
Unemployment change (000's)
Thousands
Apr
(30.00)
(11.00)
2:30PM Euro Zone
Euro-Zone GDP s.a. (QoQ)
% Change
1Q A
0.50
0.50
May 4,, 2017 6:00PM US
Change in Nonfarm payrolls
Thousands
Apr
98.00
190.00
6:00PM US
Initial Jobless claims
Thousands
Apr 29
257.00
248.00
May 5,, 2017 1:25PM Germany
PMI Services
Value
Apr F
54.70
54.70
6:00PM US
Unnemployment rate
%
Apr
4.50
4.60
May 8,, 2017
China
Exports YoY%
% Change
Apr
16.40
10.00
May 10, 2017 7:00AM China
Consumer Price Index (YoY)
% Change
Apr
0.90
1.10
India
Imports YoY%
% Change
Apr
45.30
--
India
Exports YoY%
% Change
Apr
27.60
--
May 11, 2017
US
Producer Price Index (mom)
% Change
Apr
(0.20)
--
2:00PM UK
Industrial Production (YoY)
% Change
Mar
2.80
--
4:30PM UK
BOE Announces rates
% Ratio
May 11
0.25
--
May 12, 2017 5:30PM India
Industrial Production YoY
% Change
Mar
(1.20)
--
11:30AM Germany
GDP nsa (YoY)
% Change
1Q P
1.20
--
6:00PM US
Consumer price index (mom)
% Change
Apr
(0.30)
0.30
May 15, 201712:00PM India
Monthly Wholesale Prices YoY%
% Change
Apr
5.70
--
7:30AM China
Industrial Production (YoY)
% Change
Apr
7.60
7.00
May 16, 2017 6:00PM US
Housing Starts
Thousands
Apr
1,215.00
--
6:00PM US
Building permits
Thousands
Apr
1,267.00
--
6:45PM US
Industrial Production
%
Apr
0.55
--
2:00PM UK
CPI (YoY)
% Change
Apr
2.30
--
May 17, 2017 2:30PM Euro Zone
Euro-Zone CPI (YoY)
%
Apr F
1.90
--
2:00PM UK
Jobless claims change
% Change
Apr
25.50
--
May 19, 2017 7:30PM US
New home sales
Thousands
Apr
621.00
--
Source: Bloomberg, Angel Research
Market Outlook
May 03, 2017
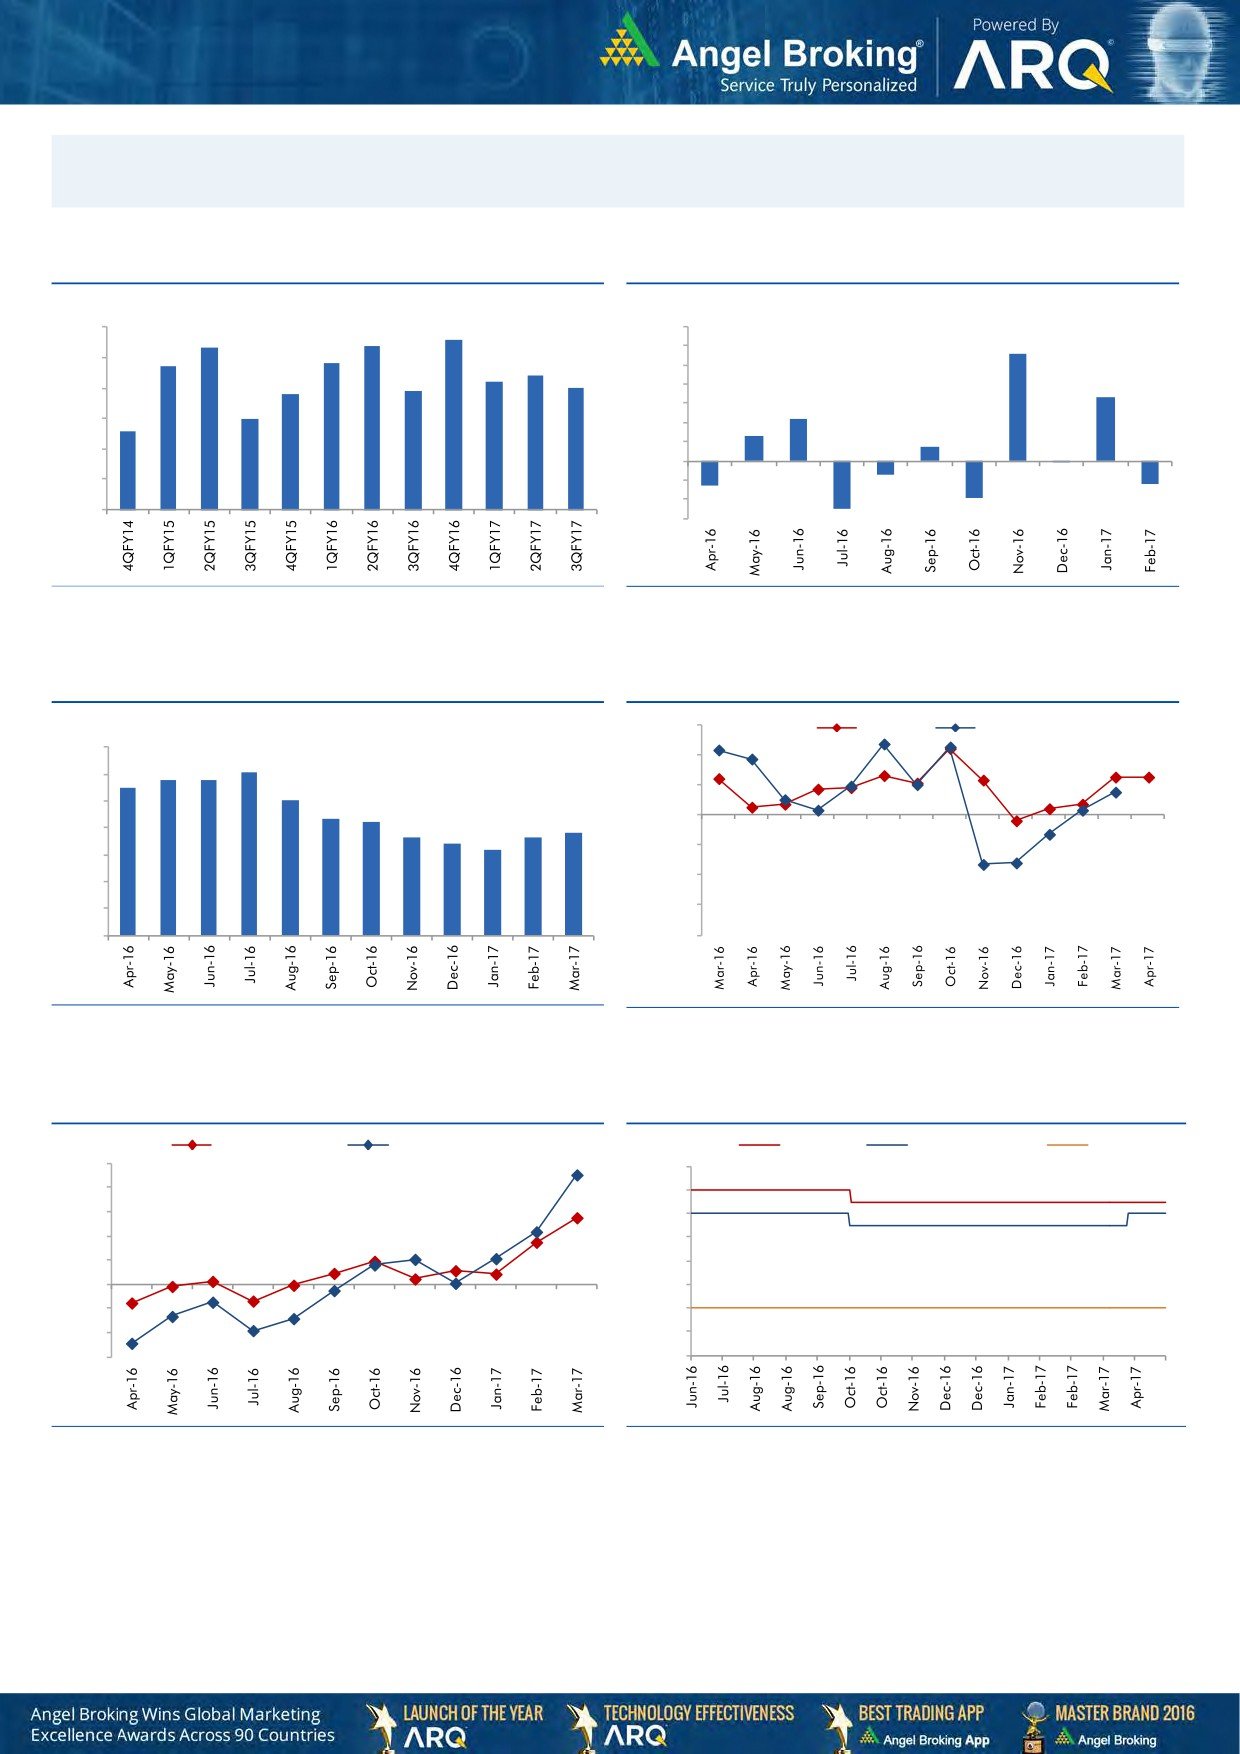
Macro watch
Exhibit 1: Quarterly GDP trends
Exhibit 2: IIP trends
(%)
(%)
8.6
9.0
8.3
8.4
7.0
5.6
7.7
7.8
6.0
8.0
7.4
7.2
5.0
6.9
7.0
6.8
3.3
7.0
4.0
6.0
3.0
2.2
5.6
6.0
2.0
1.3
0.7
1.0
5.0
-
4.0
(1.0)
(0.1)
(0.7)
(2.0)
(1.3)
(1.2)
3.0
(3.0)
(1.9)
(2.5)
Source: CSO, Angel Research
Source: MOSPI, Angel Research
Exhibit 3: Monthly CPI inflation trends
Exhibit 4: Manufacturing and services PMI
(%)
56.0
Mfg. PMI
Services PMI
7.0
6.1
54.0
5.8
5.8
6.0
5.5
5.1
52.0
5.0
4.3
4.2
3.7
3.8
50.0
4.0
3.6
3.4
3.2
48.0
3.0
46.0
2.0
1.0
44.0
-
42.0
Source: MOSPI, Angel Research
Source: Market, Angel Research; Note: Level above 50 indicates expansion
Exhibit 5: Exports and imports growth trends
Exhibit 6: Key policy rates
(%)
Exports yoy growth
Imports yoy growth
(%)
Repo rate
Reverse Repo rate
CRR
50.0
7.00
40.0
6.50
30.0
6.00
20.0
5.50
10.0
5.00
0.0
4.50
(10.0)
4.00
(20.0)
3.50
(30.0)
3.00
Source: Bloomberg, Angel Research
Source: RBI, Angel Research
Market Outlook
May 03, 2017
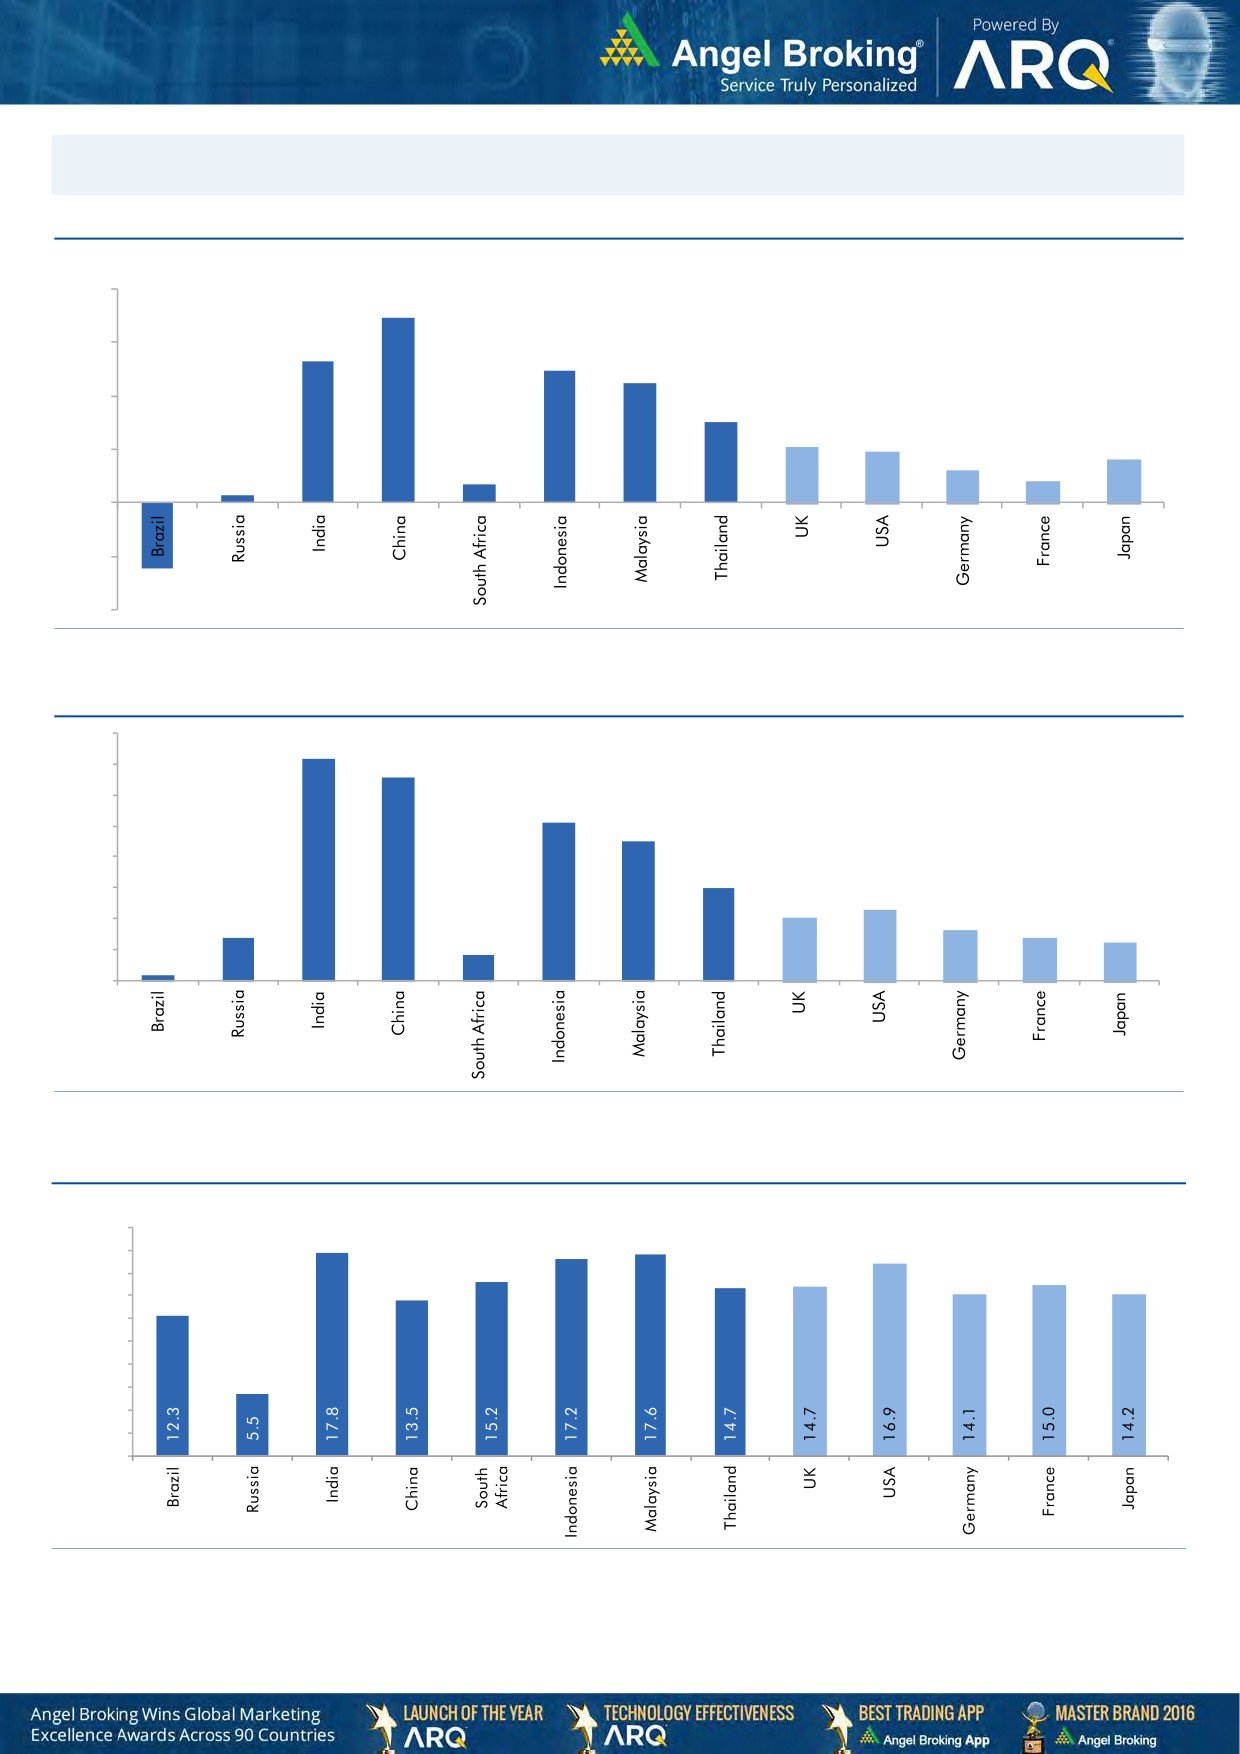
Global watch
Exhibit 1: Latest quarterly GDP Growth (%, yoy) across select developing and developed countries
(%)
8.0
6.9
6.0
5.3
4.9
0.7
4.5
4.0
3.0
2.1
1.9
2.0
0.3
1.6
1.2
0.8
-
(2.0)
(2.5)
(4.0)
Source: Bloomberg, Angel Research
Exhibit 2: 2016 GDP Growth projection by IMF (%, yoy) across select developing and developed countries
(%)
7.2
6.6
7.0
6.0
5.1
5.0
4.5
4.0
3.0
3.0
2.3
2.0
1.4
1.6
2.0
1.4
1.2
0.2
0.8
1.0
-
Source: IMF, Angel Research
Exhibit 3: One year forward P-E ratio across select developing and developed countries
(x)
20.0
18.0
16.0
14.0
12.0
10.0
8.0
6.0
4.0
2.0
-
Source: IMF, Angel Research
Market Outlook
May 03, 2017
Exhibit 4: Relative performance of indices across globe
Returns (%)
Country
Name of index
Closing price
1M
3M
1YR
Brazil
Bovespa
66,722
3.2
1.3
22.8
Russia
Micex
2,027
0.2
(10.6)
6.3
India
Nifty
9,314
2.3
9.9
16.7
China
Shanghai Composite
3,144
(3.1)
0.1
5.7
South Africa
Top 40
47,139
5.5
1.7
0.9
Mexico
Mexbol
49,589
0.5
2.7
8.6
Indonesia
LQ45
941
2.3
6.4
10.6
Malaysia
KLCI
1,778
1.7
5.1
3.7
Thailand
SET 50
993
(0.3)
0.2
10.0
USA
Dow Jones
20,950
1.1
4.9
18.0
UK
FTSE
7,250
(1.3)
0.9
18.6
Japan
Nikkei
19,446
2.8
2.1
10.7
Germany
DAX
12,508
3.0
5.9
26.7
France
CAC
5,304
5.1
9.6
22.3
Source: Bloomberg, Angel Research
Stock Watch
May 03, 2017
Company Name
Reco
CMP
Target
Mkt Cap
Sales ( Čcr )
OPM(%)
EPS (Č)
PER(x)
P/BV(x)
RoE(%)
EV/Sales(x)
(Č)
Price ( Č)
( Č cr )
FY17E
FY18E
FY17E
FY18E
FY17E
FY18E
FY17E
FY18E
FY17E
FY18E
FY17E
FY18E
FY17E
FY18E
Agri / Agri Chemical
Rallis
Neutral
239
-
4,650
1,937
2,164
13.3
14.3
9.0
11.0
26.6
21.7
4.6
4.0
18.4
19.8
2.4
2.1
United Phosphorus
Neutral
805
-
40,894
15,176
17,604
18.5
18.5
37.4
44.6
21.5
18.1
4.2
3.5
21.4
21.2
2.8
2.4
Auto & Auto Ancillary
Amara Raja Batteries
Accumulate
890
1,009
15,207
5,305
6,100
16.0
16.3
28.4
34.0
31.4
26.2
6.1
5.1
19.3
19.3
2.9
2.5
Apollo Tyres
Neutral
251
-
12,759
12,877
14,504
14.3
13.9
21.4
23.0
11.7
10.9
1.8
1.6
16.4
15.2
1.2
1.1
Ashok Leyland
Buy
84
111
23,792
20,021
21,915
11.6
11.9
4.5
5.3
18.6
15.7
3.8
3.4
20.6
21.5
1.1
1.0
Bajaj Auto
Neutral
2,905
-
84,060
25,093
27,891
19.5
19.2
143.9
162.5
20.2
17.9
5.7
4.9
30.3
29.4
3.1
2.7
Bharat Forge
Neutral
1,160
-
27,004
7,726
8,713
20.5
21.2
35.3
42.7
32.9
27.2
6.1
5.5
18.9
20.1
3.6
3.1
Ceat
Neutral
1,588
-
6,425
7,524
8,624
13.0
12.7
131.1
144.3
12.1
11.0
2.2
1.9
19.8
18.6
0.9
0.8
Eicher Motors
Neutral
25,791
-
70,177
16,583
20,447
17.5
18.0
598.0
745.2
43.1
34.6
14.7
11.2
41.2
38.3
4.1
3.2
Exide Industries
Neutral
231
-
19,614
7,439
8,307
15.0
15.0
8.1
9.3
28.5
24.8
4.0
3.6
14.3
16.7
2.3
2.0
Gabriel India
Accumulate
124
130
1,778
1,544
1,715
9.0
9.3
5.4
6.3
22.9
19.7
4.3
3.8
18.9
19.5
1.1
1.0
Hero Motocorp
Neutral
3,351
-
66,918
28,083
30,096
15.3
15.7
171.8
187.0
19.5
17.9
6.8
5.7
30.1
27.9
2.2
2.0
Indag Rubber
Neutral
216
-
566
286
326
19.8
16.8
11.7
13.3
18.5
16.2
3.1
2.9
17.8
17.1
1.6
1.4
Jamna Auto Industries
Neutral
241
-
1,924
1,486
1,620
9.8
9.9
15.0
17.2
16.1
14.0
3.5
3.0
21.8
21.3
1.4
1.2
JK Tyres
Neutral
170
-
3,860
7,455
8,056
15.0
15.0
21.8
24.5
7.8
7.0
1.6
1.3
22.8
21.3
0.6
0.6
L G Balakrishnan & Bros Neutral
638
-
1,001
1,302
1,432
11.6
11.9
43.7
53.0
14.6
12.0
2.1
1.9
13.8
14.2
0.9
0.8
Mahindra and Mahindra Neutral
1,341
-
83,288
46,534
53,077
11.6
11.7
67.3
78.1
19.9
17.2
3.2
2.8
15.4
15.8
1.8
1.5
Maruti
Neutral
6,706
-
202,564
67,822
83,288
16.0
16.4
253.8
312.4
26.4
21.5
6.1
4.9
23.0
22.9
2.7
2.1
Minda Industries
Neutral
497
-
4,295
2,728
3,042
9.0
9.1
68.2
86.2
7.3
5.8
1.7
1.3
23.8
24.3
1.6
1.4
Motherson Sumi
Neutral
401
-
56,255
45,896
53,687
7.8
8.3
13.0
16.1
30.7
24.9
9.9
7.9
34.7
35.4
1.3
1.1
Rane Brake Lining
Neutral
992
-
785
511
562
11.3
11.5
28.1
30.9
35.3
32.1
5.4
4.9
15.3
15.0
1.7
1.5
Setco Automotive
Neutral
42
-
560
741
837
13.0
13.0
15.2
17.0
2.8
2.5
0.5
0.4
15.8
16.3
1.1
1.0
Subros
Neutral
232
-
1,391
1,488
1,681
11.7
11.9
6.4
7.2
36.2
32.3
3.8
3.5
10.8
11.4
1.2
1.0
Swaraj Engines
Neutral
1,838
-
2,283
660
810
15.2
16.4
54.5
72.8
33.7
25.3
10.5
9.5
31.5
39.2
3.3
2.6
Tata Motors
Neutral
452
-
130,407
300,209
338,549
8.9
8.4
42.7
54.3
10.6
8.3
1.7
1.4
15.6
17.2
0.6
0.5
TVS Motor
Neutral
495
-
23,503
13,390
15,948
6.9
7.1
12.8
16.5
38.8
29.9
9.6
7.6
26.3
27.2
1.8
1.5
Capital Goods
ACE
Neutral
65
-
640
709
814
4.1
4.6
1.4
2.1
46.2
30.8
1.9
1.8
4.4
6.0
1.1
0.9
BEML
Neutral
1,390
-
5,787
3,451
4,055
6.3
9.2
31.4
57.9
44.3
24.0
2.7
2.4
6.3
10.9
1.8
1.5
BGR Energy
Neutral
161
-
1,158
16,567
33,848
6.0
5.6
7.8
5.9
20.6
27.2
1.2
1.1
4.7
4.2
0.2
0.1
Stock Watch
May 03, 2017
Company Name
Reco
CMP
Target
Mkt Cap
Sales ( Čcr )
OPM(%)
EPS (Č)
PER(x)
P/BV(x)
RoE(%)
EV/Sales(x)
(Č)
Price ( Č)
( Č cr )
FY17E
FY18E
FY17E
FY18E
FY17E
FY18E
FY17E
FY18E
FY17E
FY18E
FY17E
FY18E
FY17E
FY18E
Capital Goods
Bharat Electronics
Neutral
183
-
40,898
8,137
9,169
16.8
17.2
58.7
62.5
3.1
2.9
0.5
0.4
44.6
46.3
4.0
3.6
BHEL
Neutral
175
-
42,919
28,797
34,742
-
2.8
2.3
6.9
76.2
25.4
1.3
1.3
1.3
4.8
1.1
0.8
Blue Star
Accumulate
675
760
6,447
4,283
5,077
5.9
7.3
14.9
22.1
45.3
30.5
8.8
7.4
20.4
26.4
1.6
1.3
CG Power and Industrial
Neutral
78
-
4,911
5,777
6,120
5.9
7.0
3.3
4.5
23.7
17.4
1.0
1.0
4.4
5.9
0.8
0.7
Solutions
Greaves Cotton
Neutral
169
-
4,117
1,755
1,881
16.8
16.9
7.8
8.5
21.6
19.8
4.3
4.0
20.6
20.9
2.0
1.9
Inox Wind
Neutral
203
-
4,505
5,605
6,267
15.7
16.4
24.8
30.0
8.2
6.8
2.3
1.7
25.9
24.4
0.8
0.7
KEC International
Neutral
217
-
5,583
9,294
10,186
7.9
8.1
9.9
11.9
21.9
18.3
3.2
2.8
15.6
16.3
0.8
0.8
KEI Industries
Accumulate
214
239
1,668
2,682
3,058
10.4
10.0
11.7
12.8
18.3
16.7
3.7
3.0
20.1
18.2
0.8
0.7
Thermax
Neutral
1,028
-
12,253
5,421
5,940
7.3
7.3
25.7
30.2
40.0
34.1
4.8
4.4
12.2
13.1
2.1
2.0
VATech Wabag
Neutral
681
-
3,717
3,136
3,845
8.9
9.1
26.0
35.9
26.2
19.0
3.3
2.8
13.4
15.9
1.1
0.9
Voltas
Neutral
414
-
13,697
6,511
7,514
7.9
8.7
12.9
16.3
32.1
25.4
5.8
5.1
16.7
18.5
1.9
1.6
Cement
ACC
Neutral
1,590
-
29,867
11,225
13,172
13.2
16.9
44.5
75.5
35.7
21.1
3.4
3.1
11.2
14.2
2.7
2.3
Ambuja Cements
Neutral
242
-
47,993
9,350
10,979
18.2
22.5
5.8
9.5
41.7
25.4
3.5
3.1
10.2
12.5
5.1
4.4
India Cements
Neutral
211
-
6,468
4,364
4,997
18.5
19.2
7.9
11.3
26.7
18.6
1.9
1.9
8.0
8.5
2.2
2.0
J K Lakshmi Cement
Neutral
467
-
5,496
2,913
3,412
14.5
19.5
7.5
22.5
62.3
20.8
3.8
3.2
12.5
18.0
2.5
2.1
JK Cement
Neutral
975
-
6,819
4,398
5,173
15.5
17.5
31.2
55.5
31.3
17.6
3.8
3.3
12.0
15.5
2.1
1.7
Orient Cement
Neutral
166
-
3,400
2,114
2,558
18.5
20.5
8.1
11.3
20.5
14.7
3.0
2.6
9.0
14.0
2.2
1.8
UltraTech Cement
Neutral
4,205
-
115,440
25,768
30,385
21.0
23.5
111.0
160.0
37.9
26.3
4.8
4.2
13.5
15.8
4.6
3.8
Construction
Engineers India
Neutral
171
-
11,490
1,725
1,935
16.0
19.1
11.4
13.9
15.0
12.3
2.1
2.0
13.4
15.3
5.6
5.0
Gujarat Pipavav Port
Neutral
160
-
7,750
705
788
52.2
51.7
5.0
5.6
32.1
28.6
3.2
2.8
11.2
11.2
10.6
9.0
ITNL
Neutral
114
-
3,745
8,946
10,017
31.0
31.6
8.1
9.1
14.1
12.5
0.5
0.5
4.2
5.0
3.8
3.5
KNR Constructions
Neutral
202
-
2,838
1,385
1,673
14.7
14.0
41.2
48.5
4.9
4.2
0.9
0.8
14.9
15.2
2.1
1.8
Larsen & Toubro
Neutral
1,730
-
161,414
111,017
124,908
11.0
11.0
61.1
66.7
28.3
25.9
3.4
3.2
13.1
12.9
2.5
2.3
MEP Infra
Neutral
69
-
1,114
1,877
1,943
30.6
29.8
3.0
4.2
22.8
16.3
11.1
7.5
0.6
0.6
2.0
1.8
Nagarjuna Const.
Neutral
99
-
5,495
8,842
9,775
9.1
8.8
5.3
6.4
18.7
15.5
1.5
1.4
8.2
9.1
0.8
0.7
NBCC
Neutral
196
-
17,627
7,428
9,549
7.9
8.6
8.2
11.0
23.9
17.8
1.2
0.9
28.2
28.7
2.1
1.6
PNC Infratech
Neutral
160
-
4,100
2,350
2,904
13.1
13.2
9.0
8.8
17.8
18.2
0.7
0.6
15.9
13.9
1.9
1.5
Power Mech Projects
Neutral
583
-
858
1,801
2,219
12.7
14.6
72.1
113.9
8.1
5.1
1.5
1.3
16.8
11.9
0.5
0.4
Sadbhav Engineering
Neutral
338
-
5,797
3,598
4,140
10.3
10.6
9.0
11.9
37.5
28.4
3.9
3.5
9.9
11.9
1.9
1.6
Stock Watch
May 03, 2017
Company Name
Reco
CMP
Target
Mkt Cap
Sales ( Čcr )
OPM(%)
EPS (Č)
PER(x)
P/BV(x)
RoE(%)
EV/Sales(x)
(Č)
Price ( Č)
( Č cr )
FY17E
FY18E
FY17E
FY18E
FY17E
FY18E
FY17E
FY18E
FY17E
FY18E
FY17E
FY18E
FY17E
FY18E
Construction
Simplex Infra
Neutral
427
-
2,113
6,829
7,954
10.5
10.5
31.4
37.4
13.6
11.4
1.4
1.3
9.9
13.4
0.7
0.6
SIPL
Neutral
100
-
3,522
1,036
1,252
65.5
66.2
(8.4)
(5.6)
3.8
4.3
(22.8)
(15.9)
11.6
9.7
Financials
Axis Bank
Accumulate
505
580
121,022
46,932
53,575
3.5
3.4
32.4
44.6
15.6
11.3
2.0
1.8
13.6
16.5
-
-
Bank of Baroda
Neutral
189
-
43,503
19,980
23,178
1.8
1.8
11.5
17.3
16.4
10.9
1.9
1.6
8.3
10.1
-
-
Can Fin Homes
Neutral
2,836
-
7,550
420
526
3.5
3.5
86.5
107.8
32.8
26.3
7.1
5.8
23.6
24.1
-
-
Canara Bank
Neutral
367
-
21,897
15,225
16,836
1.8
1.8
14.5
28.0
25.3
13.1
1.8
1.4
5.8
8.5
-
-
Cholamandalam Inv. &
Accumulate
1,088
1,230
17,010
2,012
2,317
6.3
6.3
42.7
53.6
25.5
20.3
4.0
3.5
16.9
18.3
-
-
Fin. Co.
Dewan Housing Finance Neutral
447
-
14,010
2,225
2,688
2.9
2.9
29.7
34.6
15.1
12.9
2.4
1.6
16.1
14.8
-
-
Equitas Holdings
Buy
163
235
5,498
939
1,281
11.7
11.5
5.8
8.2
28.1
19.9
2.4
2.2
10.9
11.5
-
-
Federal Bank
Accumulate
113
125
19,393
8,259
8,995
3.0
3.0
4.3
5.6
26.2
20.1
2.2
2.1
8.5
10.1
-
-
HDFC
Neutral
1,583
-
251,478
11,475
13,450
3.4
3.4
45.3
52.5
34.9
30.2
6.7
6.0
20.2
20.5
-
-
HDFC Bank
Accumulate
1,542
1,650
395,445
46,097
55,433
4.5
4.5
58.4
68.0
26.4
22.7
4.6
3.9
18.8
18.6
-
-
ICICI Bank
Accumulate
276
315
160,753
42,800
44,686
3.1
3.3
18.0
21.9
15.3
12.6
2.1
1.9
11.1
12.3
-
-
Karur Vysya Bank
Buy
121
140
7,297
5,640
6,030
3.3
3.2
8.9
10.0
13.6
12.1
1.4
1.3
11.2
11.4
-
-
Lakshmi Vilas Bank
Neutral
181
-
3,461
3,339
3,799
2.7
2.8
11.0
14.0
16.4
12.9
1.7
1.6
11.2
12.7
-
-
LIC Housing Finance
Neutral
705
-
35,596
3,712
4,293
2.6
2.5
39.0
46.0
18.1
15.3
3.4
2.9
19.9
20.1
-
-
Punjab Natl.Bank
Neutral
171
-
36,335
23,532
23,595
2.3
2.4
6.8
12.6
25.1
13.6
3.9
2.8
3.3
6.5
-
-
RBL Bank
Neutral
585
-
21,966
1,783
2,309
2.6
2.6
12.7
16.4
46.1
35.7
5.0
4.5
12.8
13.3
-
-
Repco Home Finance
Accumulate
771
825
4,825
388
457
4.5
4.2
30.0
38.0
25.7
20.3
4.3
3.6
18.0
19.2
-
-
South Ind.Bank
Neutral
26
-
4,606
6,435
7,578
2.5
2.5
2.7
3.1
9.5
8.2
1.2
1.0
10.1
11.2
-
-
St Bk of India
Neutral
288
-
233,767
88,650
98,335
2.6
2.6
13.5
18.8
21.4
15.3
2.0
1.8
7.0
8.5
-
-
Union Bank
Neutral
171
-
11,721
13,450
14,925
2.3
2.3
25.5
34.5
6.7
4.9
1.0
0.8
7.5
10.2
-
-
Yes Bank
Neutral
1,631
-
74,494
8,978
11,281
3.3
3.4
74.0
90.0
22.0
18.1
4.2
3.6
17.0
17.2
-
-
FMCG
Akzo Nobel India
Neutral
1,962
-
9,411
2,955
3,309
13.3
13.7
57.2
69.3
34.3
28.3
11.2
9.4
32.7
33.3
3.0
2.6
Asian Paints
Neutral
1,116
-
107,018
17,128
18,978
16.8
16.4
19.1
20.7
58.4
53.9
20.3
19.2
34.8
35.5
6.2
5.6
Britannia
Neutral
3,572
-
42,868
9,594
11,011
14.6
14.9
80.3
94.0
44.5
38.0
18.3
14.1
41.2
-
4.3
3.7
Colgate
Neutral
1,029
-
28,000
4,605
5,149
23.4
23.4
23.8
26.9
43.3
38.3
23.9
18.7
64.8
66.8
6.0
5.4
Dabur India
Accumulate
284
304
50,045
8,315
9,405
19.8
20.7
8.1
9.2
35.1
30.9
9.8
8.1
31.6
31.0
5.7
5.0
GlaxoSmith Con*
Neutral
5,180
-
21,786
4,350
4,823
21.2
21.4
179.2
196.5
28.9
26.4
7.7
6.5
27.1
26.8
4.4
3.9
Stock Watch
May 03, 2017
Company Name
Reco
CMP
Target
Mkt Cap
Sales ( Čcr )
OPM(%)
EPS (Č)
PER(x)
P/BV(x)
RoE(%)
EV/Sales(x)
(Č)
Price ( Č)
( Č cr )
FY17E FY18E
FY17E
FY18E
FY17E
FY18E
FY17E
FY18E
FY17E
FY18E
FY17E
FY18E
FY17E
FY18E
FMCG
Godrej Consumer
Neutral
1,778
-
60,549
10,235
11,428
18.4
18.6
41.1
44.2
43.3
40.2
9.6
8.1
24.9
24.8
6.0
5.3
HUL
Neutral
929
-
201,003
35,252
38,495
17.8
17.8
20.7
22.4
45.0
41.5
43.0
36.9
95.6
88.9
5.5
5.1
ITC
Neutral
279
-
338,426
40,059
44,439
38.3
39.2
9.0
10.1
31.0
27.5
8.7
7.6
27.8
27.5
8.0
7.2
Marico
Neutral
319
-
41,166
6,430
7,349
18.8
19.5
6.4
7.7
49.8
41.4
15.1
12.7
33.2
32.5
6.2
5.4
Nestle*
Neutral
6,715
-
64,739
10,073
11,807
20.7
21.5
124.8
154.2
53.8
43.5
22.1
19.9
34.8
36.7
6.2
5.3
Procter & Gamble
Neutral
7,379
-
23,954
2,939
3,342
23.2
23.0
146.2
163.7
50.5
45.1
12.8
10.6
25.3
23.5
7.7
6.7
Hygiene
Tata Global
Neutral
158
-
9,953
8,675
9,088
9.8
9.8
7.4
8.2
21.3
19.2
1.7
1.6
7.9
8.1
1.1
1.0
IT
HCL Tech^
Buy
822
1,000
117,333
49,242
57,168
20.5
20.5
55.7
64.1
14.8
12.8
3.0
2.3
20.3
17.9
2.2
1.8
Infosys
Buy
921
1,179
211,549
68,484
73,963
26.0
26.0
63.0
64.0
14.6
14.4
3.1
2.8
20.8
19.7
2.8
2.4
TCS
Buy
2,292
2,651
451,612
117,966
127,403
27.5
27.6
134.3
144.5
17.1
15.9
5.1
4.7
29.8
29.7
3.5
3.2
Tech Mahindra
Buy
418
600
40,722
29,673
32,937
15.5
17.0
32.8
39.9
12.7
10.5
2.5
2.2
19.6
20.7
1.1
0.9
Wipro
Buy
495
570
120,390
55,421
58,536
20.3
20.3
35.1
36.5
14.1
13.6
2.4
2.1
19.2
14.6
1.6
1.4
Media
D B Corp
Neutral
378
-
6,953
2,297
2,590
27.4
28.2
21.0
23.4
18.0
16.2
4.2
3.6
23.7
23.1
2.8
2.4
Hindustan Media
Neutral
290
-
2,128
1,016
1,138
24.3
25.2
27.3
30.1
10.6
9.6
2.0
1.8
16.2
15.8
1.4
1.2
Ventures
HT Media
Neutral
82
-
1,912
2,693
2,991
12.6
12.9
7.9
9.0
10.4
9.1
0.9
0.8
7.8
8.3
0.3
0.2
Jagran Prakashan
Accumulate
198
225
6,458
2,355
2,635
28.0
28.0
10.8
12.5
18.3
15.8
4.0
3.4
21.7
21.7
2.8
2.4
Sun TV Network
Neutral
924
-
36,394
2,850
3,265
70.1
71.0
26.2
30.4
35.3
30.4
9.0
8.0
24.3
25.6
12.4
10.7
TV Today Network
Buy
271
344
1,615
567
645
26.7
27.0
15.4
18.1
17.6
15.0
2.6
2.3
14.9
15.2
2.4
2.0
Metals & Mining
Coal India
Neutral
275
-
170,859
84,638
94,297
21.4
22.3
24.5
27.1
11.2
10.2
4.7
4.5
42.6
46.0
1.5
1.4
Hind. Zinc
Neutral
269
-
113,450
14,252
18,465
55.9
48.3
15.8
21.5
17.0
12.5
2.8
2.4
17.0
20.7
8.0
6.1
Hindalco
Neutral
200
-
44,900
107,899
112,095
7.4
8.2
9.2
13.0
21.8
15.4
1.1
1.0
4.8
6.6
0.9
0.9
JSW Steel
Neutral
196
-
47,329
53,201
58,779
16.1
16.2
130.6
153.7
1.5
1.3
0.2
0.2
14.0
14.4
1.7
1.4
NMDC
Neutral
128
-
40,340
6,643
7,284
44.4
47.7
7.1
7.7
18.0
16.6
1.6
1.5
8.8
9.2
3.8
3.5
SAIL
Neutral
59
-
24,471
47,528
53,738
(0.7)
2.1
(1.9)
2.6
22.8
0.6
0.6
(1.6)
3.9
1.4
1.2
Tata Steel
Neutral
445
-
43,243
121,374
121,856
7.2
8.4
18.6
34.3
23.9
13.0
1.5
1.4
6.1
10.1
1.0
1.0
Vedanta
Neutral
242
-
71,701
71,744
81,944
19.2
21.7
13.4
20.1
18.1
12.0
1.5
1.4
8.4
11.3
1.4
1.1
Oil & Gas
Cairn India
#VALUE!
9,127
10,632
4.3
20.6
8.8
11.7
3.3
4.2
GAIL
Neutral
430
-
72,718
56,220
65,198
9.3
10.1
27.1
33.3
15.9
12.9
1.5
1.4
9.3
10.7
1.5
1.3
Indian Oil Corp
Neutral
443
-
215,141
373,359
428,656
5.9
5.5
54.0
59.3
8.2
7.5
1.3
1.1
16.0
15.6
0.7
0.6
Stock Watch
May 03, 2017
Company Name
Reco
CMP
Target
Mkt Cap
Sales ( Čcr )
OPM(%)
EPS (Č)
PER(x)
P/BV(x)
RoE(%)
EV/Sales(x)
(Č)
Price ( Č)
( Č cr )
FY17E FY18E
FY17E
FY18E
FY17E
FY18E
FY17E
FY18E
FY17E
FY18E
FY17E
FY18E
FY17E
FY18E
Oil & Gas
ONGC
Neutral
192
-
246,591
137,222
152,563
15.0
21.8
19.5
24.1
9.9
8.0
0.8
0.8
8.5
10.1
2.1
1.9
Reliance Industries
Neutral
1,371
-
445,725
301,963
358,039
12.1
12.6
87.7
101.7
15.6
13.5
1.6
1.5
10.7
11.3
2.0
1.6
Pharmaceuticals
Alembic Pharma
Accumulate
619
689
11,668
3,483
4,244
20.2
21.4
24.3
33.6
25.5
18.4
5.8
4.6
25.5
25.3
3.3
2.6
Alkem Laboratories Ltd
Accumulate
1,988
2,257
23,765
6,065
7,009
18.7
20.0
80.2
92.0
24.8
21.6
5.6
4.7
22.5
21.6
3.9
3.3
Aurobindo Pharma
Buy
597
877
34,963
15,720
18,078
23.7
23.7
41.4
47.3
14.4
12.6
3.8
2.9
29.6
26.1
2.4
2.1
Aventis*
Neutral
4,198
-
9,668
2,277
2,597
16.6
17.4
128.9
157.0
32.6
26.7
5.6
4.3
21.6
26.4
4.0
3.3
Cadila Healthcare
Neutral
447
-
45,807
10,429
12,318
17.7
21.6
13.1
19.2
34.2
23.3
7.2
5.7
22.8
27.1
4.4
3.6
Cipla
Sell
555
465
44,610
15,378
18,089
15.7
16.8
19.3
24.5
28.7
22.6
3.4
3.0
12.3
13.9
3.1
2.6
Dishman Pharma
Sell
309
143
4,981
1,718
1,890
22.7
22.8
9.5
11.3
32.5
27.3
3.1
2.9
10.1
10.9
3.4
3.0
Dr Reddy's
Neutral
2,580
-
42,752
16,043
18,119
18.0
23.0
78.6
130.9
32.8
19.7
3.2
2.8
10.1
15.2
2.4
2.3
GSK Pharma*
Neutral
2,423
-
20,526
2,800
3,290
10.2
20.6
32.2
60.3
75.3
40.2
13.9
13.8
17.2
34.5
7.1
6.1
Indoco Remedies
Accumulate
220
240
2,028
1,112
1,289
16.2
18.2
11.6
16.0
19.0
13.8
3.0
2.6
17.0
20.1
1.9
1.6
Ipca labs
Neutral
588
-
7,419
3,258
3,747
12.8
15.3
12.1
19.2
48.6
30.6
3.0
2.8
6.4
9.5
2.4
2.1
Lupin
Buy
1,304
1,809
58,914
15,912
18,644
26.4
26.7
58.1
69.3
22.5
18.8
4.4
3.6
21.4
20.9
3.8
3.1
Natco Pharma
Accumulate
921
974
16,049
2,090
2,335
32.1
26.6
26.8
23.2
34.3
39.7
9.7
8.4
28.4
21.1
7.7
95.1
Sun Pharma
Buy
632
847
151,715
31,129
35,258
32.0
32.9
30.2
35.3
20.9
17.9
3.4
2.8
20.0
20.1
4.4
3.7
Power
NTPC
Neutral
162
-
133,659
86,605
95,545
17.5
20.8
11.8
13.4
13.7
12.1
1.4
1.3
10.5
11.1
2.9
2.9
Power Grid
Accumulate
206
223
107,771
25,315
29,193
88.2
88.7
14.2
17.2
14.6
12.0
2.2
1.9
15.2
16.1
8.9
8.0
Tata Power
Neutral
83
-
22,531
36,916
39,557
17.4
27.1
5.1
6.3
16.3
13.2
1.4
1.3
9.0
10.3
1.6
1.5
Real Estate
MLIFE
Buy
444
522
1,824
1,152
1,300
22.7
24.6
29.9
35.8
14.9
12.4
1.1
1.0
7.6
8.6
2.3
1.9
Prestige Estate
Neutral
241
-
9,043
4,707
5,105
25.2
26.0
10.3
13.0
23.4
18.6
1.9
1.7
10.3
10.2
3.1
2.8
Telecom
Bharti Airtel
Neutral
348
-
138,910
105,086
114,808
34.5
34.7
12.2
16.4
28.5
21.2
1.9
1.8
6.8
8.4
2.2
1.9
Idea Cellular
Neutral
85
-
30,541
40,133
43,731
37.2
37.1
6.4
6.5
13.2
13.0
1.1
1.0
8.2
7.6
1.8
1.5
zOthers
Abbott India
Neutral
4,264
-
9,060
3,153
3,583
14.1
14.4
152.2
182.7
28.0
23.3
137.5
117.5
25.6
26.1
2.6
2.2
Asian Granito
Accumulate
384
405
1,154
1,060
1,169
12.2
12.5
12.7
15.9
30.3
24.1
2.9
2.6
9.5
10.7
1.4
1.2
Bajaj Electricals
Accumulate
353
395
3,570
4,801
5,351
5.7
6.2
10.4
13.7
33.8
25.8
4.2
3.7
12.4
14.5
0.7
0.7
Banco Products (India)
Neutral
232
-
1,656
1,353
1,471
12.3
12.4
14.5
16.3
16.0
14.2
22.1
19.9
14.5
14.6
1.2
125.3
Coffee Day Enterprises
Neutral
251
-
5,171
2,964
3,260
20.5
21.2
4.7
8.0
-
31.4
2.9
2.7
5.5
8.5
2.2
1.9
Ltd
Competent Automobiles Neutral
237
-
152
1,137
1,256
3.1
2.7
28.0
23.6
8.5
10.0
45.6
41.2
14.3
11.5
0.1
0.1
Stock Watch
May 03, 2017
Company Name
Reco
CMP
Target
Mkt Cap
Sales ( Čcr )
OPM(%)
EPS (Č)
PER(x)
P/BV(x)
RoE(%)
EV/Sales(x)
(Č)
Price ( Č)
( Č cr )
FY17E
FY18E
FY17E
FY18E
FY17E
FY18E
FY17E
FY18E
FY17E
FY18E
FY17E
FY18E
FY17E
FY18E
zOthers
Elecon Engineering
Neutral
60
-
678
1,482
1,660
13.7
14.5
3.9
5.8
15.5
10.4
3.6
3.3
7.8
10.9
0.8
0.7
Finolex Cables
Neutral
527
-
8,061
2,883
3,115
12.0
12.1
14.2
18.6
37.1
28.3
19.7
17.3
15.8
14.6
2.5
2.3
Garware Wall Ropes
Neutral
795
-
1,739
863
928
15.1
15.2
36.4
39.4
21.8
20.2
4.0
3.4
17.5
15.9
1.9
1.8
Goodyear India*
Neutral
887
-
2,045
1,598
1,704
10.4
10.2
49.4
52.6
18.0
16.9
82.9
72.7
18.2
17.0
1.0
137.6
Hitachi
Neutral
1,778
-
4,835
2,081
2,433
8.8
8.9
33.4
39.9
53.2
44.6
43.0
35.8
22.1
21.4
2.3
2.0
HSIL
Neutral
342
-
2,471
2,384
2,515
15.8
16.3
15.3
19.4
22.3
17.6
22.2
19.1
7.8
9.3
1.2
1.1
Interglobe Aviation
Neutral
1,125
-
40,660
21,122
26,005
14.5
27.6
110.7
132.1
10.2
8.5
60.8
43.4
168.5
201.1
1.9
1.5
Jyothy Laboratories
Neutral
394
-
7,157
1,440
2,052
11.5
13.0
8.5
10.0
46.4
39.4
11.2
10.4
18.6
19.3
5.3
3.7
Kirloskar Engines India
Neutral
398
-
5,750
2,554
2,800
9.9
10.0
10.5
12.1
37.9
32.9
15.8
14.9
10.7
11.7
1.9
1.7
Ltd
Linc Pen & Plastics
Neutral
291
-
430
382
420
9.3
9.5
13.5
15.7
21.6
18.5
3.7
3.2
17.1
17.3
1.2
1.1
M M Forgings
Neutral
619
-
747
546
608
20.4
20.7
41.3
48.7
15.0
12.7
84.8
75.0
16.6
17.0
1.2
1.1
Manpasand Bever.
Neutral
704
-
4,028
836
1,087
19.6
19.4
16.9
23.8
41.7
29.6
5.0
4.4
12.0
14.8
4.6
3.4
Mirza International
Neutral
113
-
1,355
963
1,069
17.2
18.0
6.1
7.5
18.4
15.0
2.8
2.4
15.0
15.7
1.6
1.4
MT Educare
Neutral
79
-
314
366
417
17.7
18.2
9.4
10.8
8.4
7.3
1.9
1.6
22.2
22.3
0.8
0.7
Narayana Hrudaya
Neutral
319
-
6,521
1,873
2,166
11.5
11.7
2.6
4.0
120.7
80.5
7.4
6.7
6.1
8.3
3.6
3.1
Navkar Corporation
Buy
214
265
3,052
369
561
42.9
42.3
6.9
11.5
31.0
18.6
2.2
2.0
7.4
10.5
9.3
6.1
Navneet Education
Neutral
167
-
3,897
1,062
1,147
24.0
24.0
6.1
6.6
27.4
25.2
5.6
5.0
20.6
19.8
3.7
3.5
Nilkamal
Neutral
2,205
-
3,291
1,995
2,165
10.7
10.4
69.8
80.6
31.6
27.4
126.0
109.5
16.6
16.5
1.6
1.5
Page Industries
Neutral
14,704
-
16,401
2,450
3,124
20.1
17.6
299.0
310.0
49.2
47.4
327.5
250.0
47.1
87.5
6.7
5.3
Parag Milk Foods
Neutral
239
-
2,008
1,919
2,231
9.3
9.6
9.5
12.9
25.3
18.5
3.9
3.2
15.5
17.5
1.2
1.0
Quick Heal
Neutral
243
-
1,702
408
495
27.3
27.0
7.7
8.8
31.4
27.6
2.9
2.9
9.3
10.6
3.3
2.7
Radico Khaitan
Buy
123
147
1,630
1,667
1,824
13.0
13.2
6.7
8.2
18.4
15.0
1.7
1.5
9.0
10.2
1.4
1.2
Relaxo Footwears
Neutral
495
-
5,944
2,085
2,469
9.2
8.2
7.6
8.0
65.5
62.3
25.4
21.7
17.9
18.8
2.9
2.5
S H Kelkar & Co.
Neutral
327
-
4,729
1,036
1,160
15.1
15.0
6.1
7.2
53.6
45.6
5.7
5.3
10.7
11.5
4.4
3.9
Siyaram Silk Mills
Accumulate
1,674
1,872
1,569
1,652
1,857
11.6
11.7
92.4
110.1
18.1
15.2
2.7
2.3
14.7
15.2
1.2
1.0
Styrolution ABS India*
Neutral
733
-
1,290
1,440
1,537
9.2
9.0
40.6
42.6
18.1
17.2
46.1
41.9
12.3
11.6
0.9
0.8
Surya Roshni
Neutral
265
-
1,161
3,342
3,625
7.8
7.5
17.3
19.8
15.3
13.4
29.1
23.4
10.5
10.8
0.6
0.5
Team Lease Serv.
Neutral
1,086
-
1,857
3,229
4,001
1.5
1.8
22.8
32.8
47.7
33.1
5.1
4.4
10.7
13.4
0.5
0.4
The Byke Hospitality
Neutral
208
-
835
287
384
20.5
20.5
7.6
10.7
27.4
19.5
5.7
4.6
20.7
23.5
2.9
2.2
Stock Watch
May 03, 2017
Company Name
Reco
CMP
Target Mkt Cap
Sales ( Čcr )
OPM(%)
EPS (Č)
PER(x)
P/BV(x)
RoE(%)
EV/Sales(x)
(Č)
Price ( Č)
( Č cr )
FY17E FY18E FY17E FY18E FY17E FY18E FY17E FY18E FY17E FY18E FY17E FY18E FY17E FY18E
zOthers
Transport Corporation of
Neutral
247
-
1,895
2,671
2,911
8.5
8.8
13.9
15.7
17.9
15.8
2.4
2.2
13.7
13.8
0.8
0.8
India
TVS Srichakra
Neutral
4,213
-
3,226
2,304
2,614
13.7
13.8
231.1
266.6
18.2
15.8
473.4
372.8
33.9
29.3
1.4
1.2
UFO Moviez
Neutral
455
-
1,256
619
685
33.2
33.4
30.0
34.9
15.2
13.0
2.1
1.8
13.8
13.9
1.7
1.4
Visaka Industries
Neutral
328
-
521
1,051
1,138
10.3
10.4
21.0
23.1
15.6
14.2
42.1
39.4
9.0
9.2
0.8
0.7
VRL Logistics
Neutral
339
-
3,092
1,902
2,119
16.7
16.6
14.6
16.8
23.3
20.1
5.1
4.5
21.9
22.2
1.7
1.5
Wonderla Holidays
Neutral
386
-
2,178
287
355
38.0
40.0
11.3
14.2
34.1
27.2
4.9
4.3
21.4
23.9
7.3
5.9
VIP Industries
Accumulate
201
218
2,843
1,270
1,450
10.4
10.4
5.6
6.5
35.9
31.0
7.5
6.5
20.7
21.1
2.2
2.0
Navin Fluorine
Buy
3,002
3,650
2,939
789
945
21.1
22.4
120.1
143.4
25.0
20.9
4.0
3.5
17.8
18.5
3.7
3.0
Source: Company, Angel Research; Note: *December year end; #September year end; &October year end; Price as on May 02, 2017
Market Outlook
May 03, 2017
Research Team Tel: 022 - 39357800
DISCLAIMER
Angel Broking Private Limited (hereinafter referred to as “Angel”) is a registered Member of National Stock Exchange of India
Limited,Bombay Stock Exchange Limited and Metropolitan Stock Exchange Limited. It is also registered as a Depository Participant with
CDSL and Portfolio Manager with SEBI. It also has registration with AMFI as a Mutual Fund Distributor. Angel Broking Private Limited is a
registered entity with SEBI for Research Analyst in terms of SEBI (Research Analyst) Regulations, 2014 vide registration number
INH000000164. Angel or its associates has not been debarred/ suspended by SEBI or any other regulatory authority for accessing
/dealing in securities Market. Angel or its associates/analyst has not received any compensation / managed or
co-managed public offering of securities of the company covered by Analyst during the past twelve months.
This document is solely for the personal information of the recipient, and must not be singularly used as the basis of any investment
decision. Nothing in this document should be construed as investment or financial advice. Each recipient of this document should make
such investigations as they deem necessary to arrive at an independent evaluation of an investment in the securities of the companies
referred to in this document (including the merits and risks involved), and should consult their own advisors to determine the merits and
risks of such an investment.
Reports based on technical and derivative analysis center on studying charts of a stock's price movement, outstanding positions and
trading volume, as opposed to focusing on a company's fundamentals and, as such, may not match with a report on a company's
fundamentals. Investors are advised to refer the Fundamental and Technical Research Reports available on our website to evaluate the
contrary view, if any.
The information in this document has been printed on the basis of publicly available information, internal data and other reliable
sources believed to be true, but we do not represent that it is accurate or complete and it should not be relied on as such, as this
document is for general guidance only. Angel Broking Pvt. Limited or any of its affiliates/ group companies shall not be in any way
responsible for any loss or damage that may arise to any person from any inadvertent error in the information contained in this report.
Angel Broking Pvt. Limited has not independently verified all the information contained within this document. Accordingly, we cannot
testify, nor make any representation or warranty, express or implied, to the accuracy, contents or data contained within this document.
While Angel Broking Pvt. Limited endeavors to update on a reasonable basis the information discussed in this material, there may be
regulatory, compliance, or other reasons that prevent us from doing so.
This document is being supplied to you solely for your information, and its contents, information or data may not be reproduced,
redistributed or passed on, directly or indirectly.
Neither Angel Broking Pvt. Limited, nor its directors, employees or affiliates shall be liable for any loss or damage that may arise from
or in connection with the use of this information.